Active Session History (ASH) provides a comprehensive view of current and historical system activity by sampling session activity within the database. A session or connection is considered active if it is utilizing CPU resources or engaged in an active RPC call waiting on specific wait events.
ASH leverages SQL views to expose session activity, enabling you to run analytical queries, perform aggregations, and diagnose performance issues efficiently. To utilize ASH, you need to enable YSQL.
Currently, ASH supports YSQL, YCQL, and YB-TServer. It facilitates performance analysis by recording wait events associated with YSQL, YCQL, or YB-TServer requests during execution. These wait events fall into various categories, including CPU usage, WaitOnCondition, Network, and Disk IO, among others.
With ASH, you can gain deep insights into database activity, helping you optimize performance and resolve bottlenecks effectively.
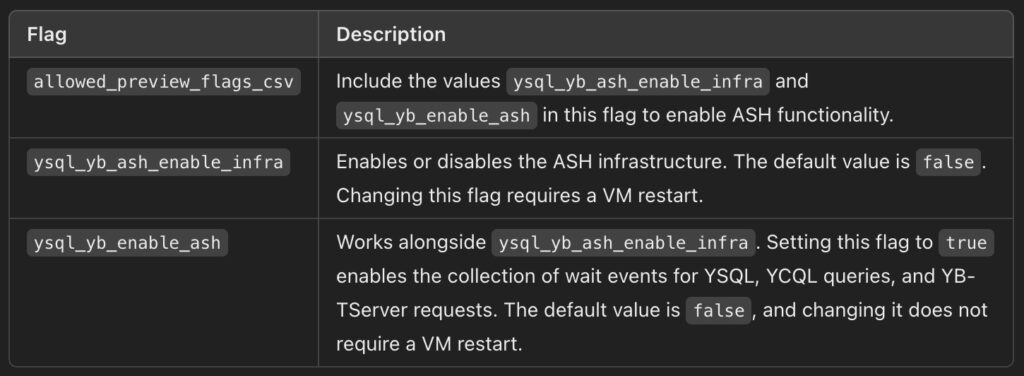
To enable and use ASH in YugabyteDB, you need to configure specific flags on each node of your cluster. Here’s a breakdown of the required flags and their purposes:

For example, I could start a YugabyteDB cluster enabling ASH with the following yugabyted command:
yugabyted start --tserver_flags="allowed_preview_flags_csv={ysql_yb_ash_enable_infra,ysql_yb_enable_ash},ysql_yb_ash_enable_infra=true,ysql_yb_enable_ash=true" --master_flags="allowed_preview_flags_csv={ysql_yb_ash_enable_infra,ysql_yb_enable_ash},ysql_yb_ash_enable_infra=true,ysql_yb_enable_ash=true"
When activated, ASH provides the following views on each node to assist in analyzing and troubleshooting performance issues:
yb_active_session_history: This view displays a list of wait events along with their associated metadata.
					yugabyte=# \d yb_active_session_history
                   View "pg_catalog.yb_active_session_history"
        Column        |           Type           | Collation | Nullable | Default
----------------------+--------------------------+-----------+----------+---------
 sample_time          | timestamp with time zone |           |          |
 root_request_id      | uuid                     |           |          |
 rpc_request_id       | bigint                   |           |          |
 wait_event_component | text                     |           |          |
 wait_event_class     | text                     |           |          |
 wait_event           | text                     |           |          |
 top_level_node_id    | uuid                     |           |          |
 query_id             | bigint                   |           |          |
 pid                  | integer                  |           |          |
 client_node_ip       | text                     |           |          |
 wait_event_aux       | text                     |           |          |
 sample_weight        | real                     |           |          |
 wait_event_type      | text                     |           |          |
 ysql_dbid            | oid                      |           |          |
yb-wait-event-desc: This view displays information about wait events.
					yugabyte=# \d yb_wait_event_desc
              View "pg_catalog.yb_wait_event_desc"
         Column         | Type | Collation | Nullable | Default
------------------------+------+-----------+----------+---------
 wait_event_class       | text |           |          |
 wait_event_type        | text |           |          |
 wait_event             | text |           |          |
 wait_event_description | text |           |          |
Let’s explore an example where we examine the distribution of wait events for each query executed in the past 10 minutes.
Since ASH’s query_id matches the queryid in pg_stat_statements, you can join these two views to analyze the distribution of wait events for each query. This can help identify issues with a specific query or determine where the majority of time is being spent.
					SELECT queryid,
        pid,
        query,
        wait_event_component,
        wait_event,
        wait_event_type,
        COUNT(*) event_count
   FROM yb_active_session_history
   JOIN pg_stat_statements
     ON query_id = queryid
  WHERE sample_time >= current_timestamp - interval '10 minutes'
  GROUP
     BY queryid,
        pid,
        query,
        wait_event_component,
        wait_event,
        wait_event_type
  ORDER
     BY queryid,
        wait_event_component,
        wait_event_type;
					-      queryid       |  pid   |                            query                            | wait_event_component |             wait_event             | wait_event_type | event_count
---------------------+--------+-------------------------------------------------------------+----------------------+------------------------------------+-----------------+-------------
 1049962867434605345 | 261354 | INSERT INTO test SELECT g, g FROM generate_series($1, $2) g | TServer              | OnCpu_Active                       | Cpu             |       1
 1049962867434605345 | 261354 | INSERT INTO test SELECT g, g FROM generate_series($1, $2) g | TServer              | ConflictResolution_ResolveConficts | Network         |       2
 1049962867434605345 | 261354 | INSERT INTO test SELECT g, g FROM generate_series($1, $2) g | YSQL                 | StorageFlush                       | Network         |       1
 4007854455770966482 | 261354 | CREATE TABLE test(c1 INT, c2 INT)                           | YSQL                 | QueryProcessing                    | Cpu             |       1
(4 rows)
In this example, the data shows that in the YB-TServer, most of the time is spent on the wait event ConflictResolution_WaitOnConflictingTxns. This indicates a high number of conflicts occurring in the DocDB storage layer.
Check out the official YugabyteDB doc page for more examples!
Have Fun!

